MER Morphology Cookbook
Introduction
The MER final catalog contains a wealth of morphological information collected for all objects and across all bands (VIS, NIR and EXT). In this cookbook we document the various flavors of morphological information available.
Detection morphology
As part of the detection process we calculate rather simple morphological parameters. These parameters are computed from the light distribution within the detection mosaic area (either in the VIS band or in the NIR-stack band).
The relevant columns in the MER main catalog FITS file are:
SEMIMAJOR_AXIS: the semi-major axis of the ellipse describing the object shape, in pixel units;POSITION_ANGLE: the position angle of the ellipse describing the object shape, in degrees and using a counter-clockwise NE-SW convention;ELLIPTICITY: the ellipticity of the ellipse describing the object shape.
The information content of those columns corresponds to the parameters
A_IMAGE, B_IMAGE, THETA_IMAGE, as provided by SExtractor, or
ellipse_a, ellipse_b, ellipse_theta, as provided by
SourceXtractor++.
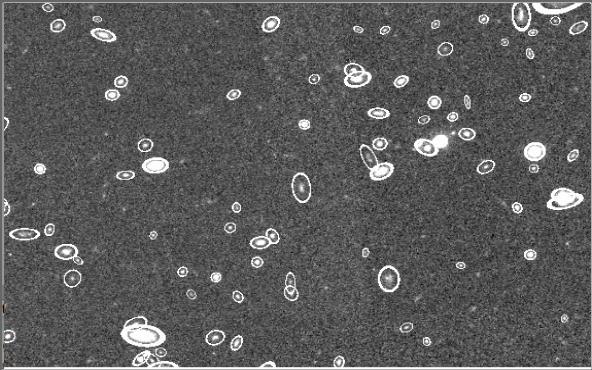
Fig. 32 A cutout of a VIS detection mosaic (size ~ 50’’ x 30’’) with the ellipses associated to each detected object.
Extended CAS morphology
The parameters Concentration, Asymmetry and Clumpiness (CAS) correlate with important modes of galaxy evolution: star formation and major merging activity. In the MER pipeline these parameters are computed for VIS detected objects following Conselice 2003 (and references given therein). In addition, we compute the Gini coefficient and the \(M_{20}\) coefficient described in Lotz, Primack & Madau 2004.
The extended CAS values are stored in the MER morphology catalog FITS file in the following columns:
CONCENTRATIONASYMMETRYSMOOTHNESSGINIMOMENT_20
Zoobot morphology
Zoobot is a deep learning model trained to measure detailed morphology (bars, spiral arms, mergers, etc) using labels from Galaxy Zoo citizen scientists.
The MER final catalog
includes columns with these predictions for galaxies which are either bright
enough (VIS < 20.5 mag) or extended enough (SEGMENTATION_AREA > 1200
pixels) that detailed morphology measurement makes sense. This is roughly 2% of
all MER sources.
Zoobot columns are named like {question}_{answer}. For example, the column
SMOOTH_OR_FEATURED_SMOOTH measures the prediction for how many volunteers
would answer “smooth” to the question: “is this galaxy smooth or featured?”
The MER morphology catalog FITS file contains the following Zoobot columns:
BAR_NOBAR_STRONGBAR_WEAKBULGE_SIZE_DOMINANTBULGE_SIZE_LARGEBULGE_SIZE_MODERATEBULGE_SIZE_NONEBULGE_SIZE_SMALLCLUMP_COUNT_ANY_THRESHOLDCLUMP_COUNT_ABOVE_THRESHOLDCLUMP_COUNT_UNUSUAL_ANY_THRESHOLDCLUMP_COUNT_UNUSUAL_ABOVE_THRESHOLDDISK_EDGE_ON_NODISK_EDGE_ON_YESEDGE_ON_BULGE_BOXYEDGE_ON_BULGE_NONEEDGE_ON_BULGE_ROUNDEDLOPSIDED_NOLOPSIDED_YESHAS_SPIRAL_ARMS_NOHAS_SPIRAL_ARMS_YESHOW_ROUNDED_CIGAR_SHAPEDHOW_ROUNDED_COMPLETELYHOW_ROUNDED_IN_BETWEENMERGING_MAJOR_DISTURBANCEMERGING_MERGERMERGING_MINOR_DISTURBANCEMERGING_NONESMOOTH_OR_FEATURED_ARTIFACT_STAR_ZOOMSMOOTH_OR_FEATURED_FEATURED_OR_DISKSMOOTH_OR_FEATURED_SMOOTHSPIRAL_ARM_COUNT_1SPIRAL_ARM_COUNT_2SPIRAL_ARM_COUNT_3SPIRAL_ARM_COUNT_4SPIRAL_ARM_COUNT_CANT_TELLSPIRAL_ARM_COUNT_MORE_THAN_4SPIRAL_WINDING_LOOSESPIRAL_WINDING_MEDIUMSPIRAL_WINDING_TIGHTDWARF_YESDWARF_NOPECULIAR_YESPECULIAR_NORING_YESRING_NOAGN_YESAGN_NOETG_OR_LTGT_TYPEMAJOR_MERGERMAJOR_MERGER_UNCERTAINTYMAJOR_MERGER_STAGEMAJOR_MERGER_STAGE_PROBABILITYMAJOR_MERGER_STAGE_UNCERTAINTY
The column values encode a posterior distribution for the answers to each question. They are Dirichlet concentrations. The most common way to use these is to convert them to “the fraction of volunteers expected to select this morphology answer” with the formula:
For example, the fraction of volunteers expected to answer “smooth” is:
SMOOTH_OR_FEATURED_SMOOTH / (SMOOTH_OR_FEATURED_SMOOTH +
SMOOTH_OR_FEATURED_FEATURED_OR_DISK +
SMOOTH_OR_FEATURED_ARTIFACT_STAR_ZOOM).
For more details consult the Zoobot github page and the online documentation.
Parametric morphology
The MER pipeline performs a Sersic fit to all Euclid data. The actual fitting is done with SourceXtractor++ (Kümmel et al. 2022, Bertin et al. 2020) in no-detection mode. This fitting mode allows to perform model fits based totally on positions and fitting areas provided in the program input, and is independent of the SourceXtractor++ internal detection mechanism.
The fitting method is based on an iterative approach which takes into account the differences in the resolution of the Euclid VIS and NIR bands. First a Sersic model is fitted to the combined VIS and NIR (Y/J/H) data. In a second Sersic fitting process the parameters determined on the VIS data are used as a constant input to determine flux values on all available EXT bands.
This fitting procedure was validated using Euclid data taken in the COSMOS field.
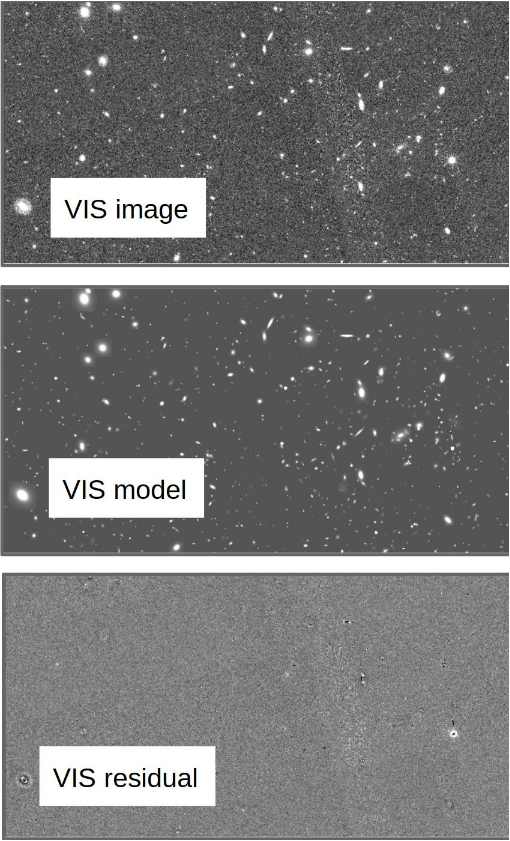
Fig. 33 An illustration of the Sersic fitting result showing a cutout of the original VIS mosaic (top), the Sersic model image (middle), and the residual image (bottom).
In order to keep the processing time in a reasonable range we implemented a few limitations:
A large amount of processing time is usually spent on the bright stars in the FoV, since the fitting area, which is derived from the segmentation area, is usually very large and thus involves a large data volume. Since these objects are often saturated and do not promise reasonable fitting results, we have set the fitting box to 50 x 50 pixels for all objects that, according to their segmentation imprint, have a fitting area > 300 x 300 pixels.
All objects that descended from the same parent object via deblending are collected into a single fitting group, which means that the minimization of their Sersic parameters is done together. Also in this area bright stars usually result into a fitting group with many members since the deblending tends to generate multiple objects along the diffraction spikes and in the saturated core. Since this again would result in a long processing time for one group only, we limit the number of objects in a group to 150.
The flux values from the Sersic fitting procedure for all photometric bands are stored in the MER main catalog FITS file (see the MER photometry cookbok for more details) with column names:
FLUX_<band>_SERSIC
The MER morphology catalog FITS file contains the parameters and qualitative results from the Sersic fits:
SERSIC_SERSIC_VIS_{RADIUS, AXIS_RATIO, INDEX}SERSIC_SERSIC_NIR_{RADIUS, AXIS_RATIO, INDEX}SERSIC_ANGLESERSIC_VISNIR_{REDUCED_CHI2, ITERATIONS, FLAGS, DURATION}SERSIC_EXT_{REDUCED_CHI2, ITERATIONS, FLAGS, DURATION}
Point-like probability
A simple Star-Galaxy (S/G) classifier has been historically implemented in the
MER pipeline in order to identify the point-like detected objects on which the
PSF characterization could be performed by SHE. In addition to the
POINT_LIKE_FLAG, a point-like probability (POINT_LIKE_PROB) was also
requested in the output catalog. Both values are stored in the
MER main catalog FITS file for VIS-detected
objects. Notice that this classifier is heavily biased towards a high purity,
and thus has a low completeness.
The method is inspired from the SPREAD_MODEL method provided by
SExtractor which is used in
Desai et al. 2012 and
Sevilla-Noarbe et al. 2018.
Our method uses MU_MAX - MAG_AUTO as a proxy of SPREAD_MODEL;
MU_MAX being the peak surface brightness above the background. Thus, our
estimator MU_MAX - MAG_AUTO is related to the concentration of light
at the peak versus the total magnitude.
As shown in Fig. 34, the S/G separation is only
performed in VIS-detected objects. The current rule-of-thumb to select stars in
the MER catalog is: select very bright (even saturated) sources at VIS AB
magnitudes < 17, and to add all detections with POINT_LIKE_PROB > 0.96.
Notice that POINT_LIKE_FLAG is defined as POINT_LIKE_PROB > 0.96
AND DET_QUALITY_FLAG = 0, so this flag can also be used.
For a more complete selection of stars, please use in addition the color and SED fitting information provided by PHZ.
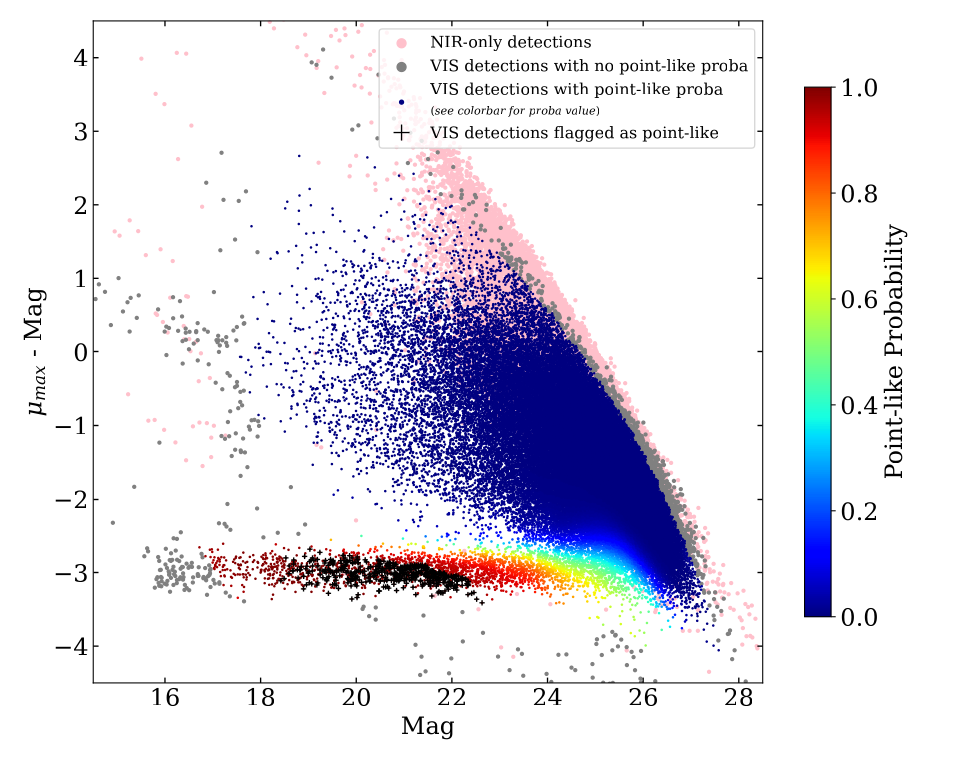
Fig. 34 VIS and NIR detections in the MU_MAX - MAG_AUTO plane for real
data from tile 102021495. Stars are prominently present in the bottom
horizontal branch. Black cross: sources identified as stars. Colors code the
probability of being a point source.