Introduction
The SPE Processing Function is in charge of measuring the spectroscopic redshift of astronomical objects observed with the NISP spectrograph. In addition to the redshift, a measure of the flux of the main emission lines and other several spectral features is performed. To complete the process, an estimate of the accuracy and reliability of the measurements will be provided.
A classification is also given to disciminate astronomical source between stars, galaxies or QSO.
Inputs to the SPE Pipeline are 1D combined spectra provided by the SIR Processing Function. This SIR product is defined over one MER tile (as defined by MER Processing Function).
The SPE Processing Function produces the SPE PF output catalog product. This SPE product is defined over one MER tile.
List of SPE Data Products
It is possible to identify two SPE Data Products types:
The SPE Output Data Product as result of the pipeline execution over a MER tile
The SPE Internal Data Products used for internal/technical purpose
SPE Output Data Product
Data Product |
Ddp Name |
Description |
|---|---|---|
DpdSpePfOutputCatalog |
Redshift and lines catalog |
SPE Pipeline
The SPE pipeline fits QSO, star and galaxy spectrum models on input spectrum by using several continuum templates. A line model is also used for galaxy modeling. Up to 5 Redshift solutions is estimated. The reliability of the Redshift estimate is compute with deep learning algorithm and then spectral features are measured.
The SPE pipeline is massively parallelized by splitting the set of input spectra in several spectrum bunches.
A validation process ends the pipeline.
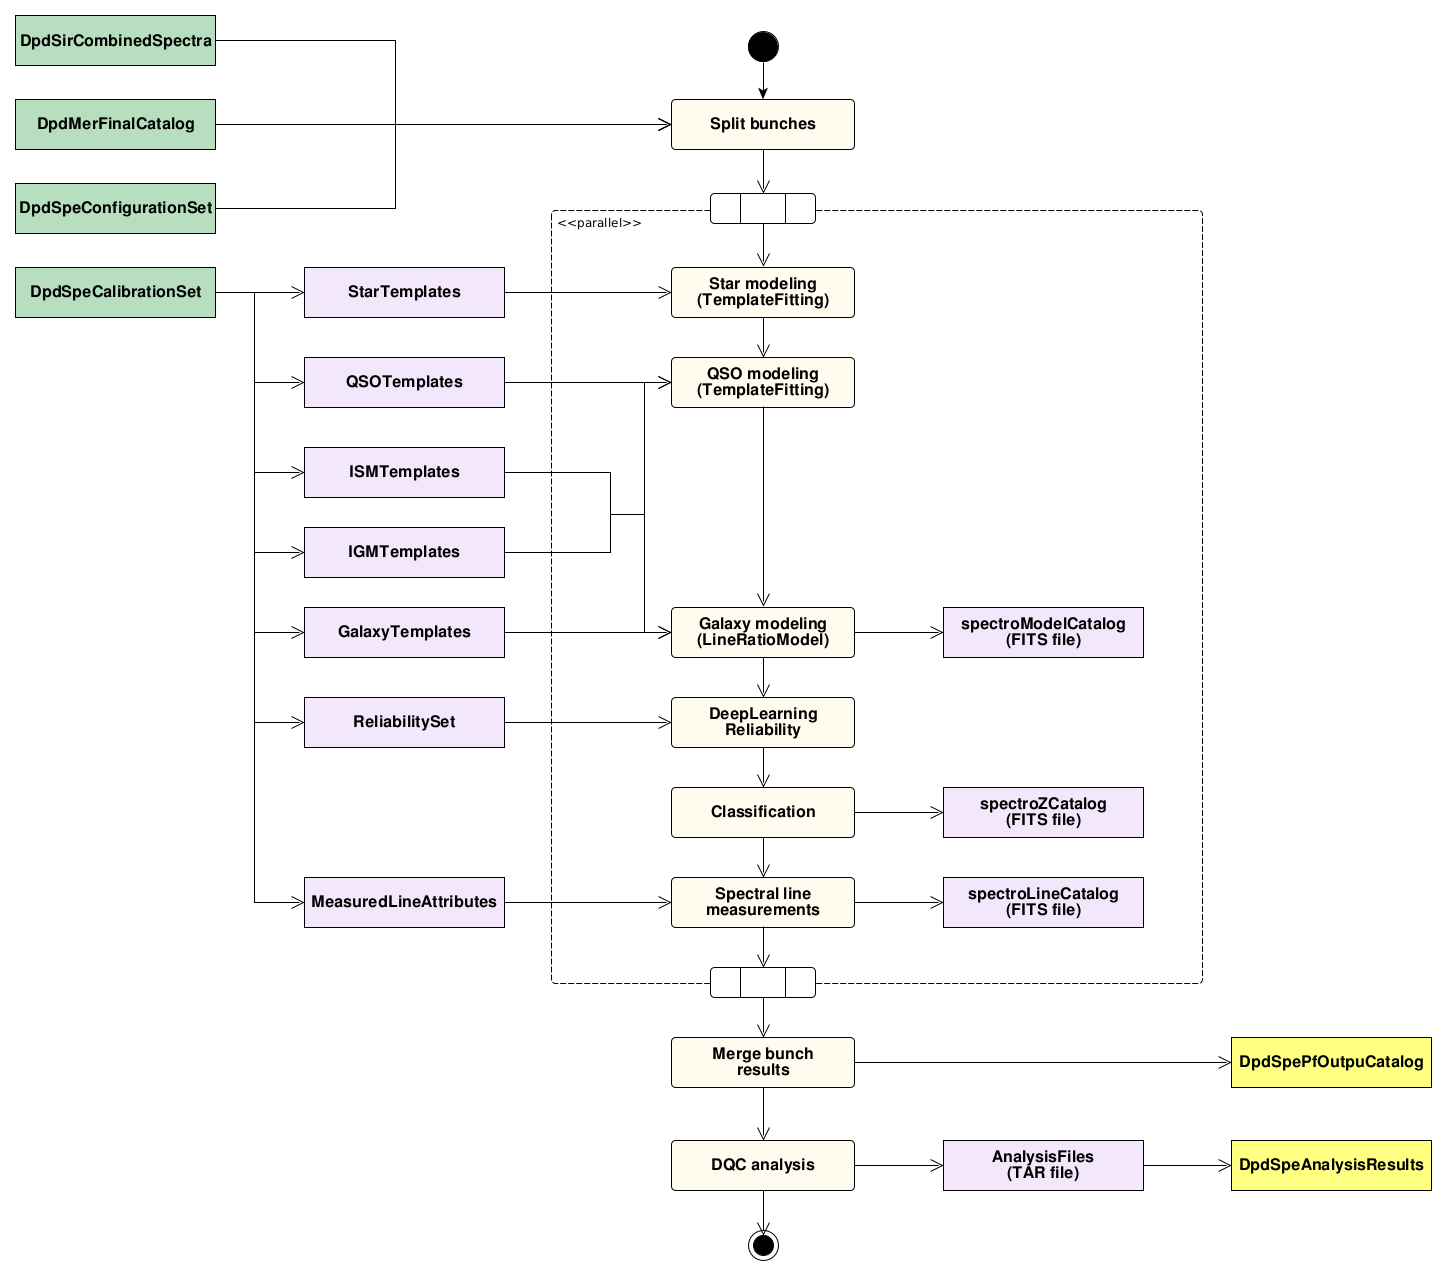
Fig. 35 SPE PF pipeline overview