Introduction
The MER Processing Function realizes the merging of all the level 2 information and provides source catalogs containing photometric and morphological object information relevant to the Euclid project.
Inputs to the MER Pipeline are image lists (calibrated frames and stacks) and associated products (PSFs, zero points) provided by the VIS, NIR and EXT Stage-2 Processing Functions. Some of these inputs are optional, since the MER pipeline is flexible enough to work even in those cases when some of the NIR calibrated frames or the EXT stacks are not available.
A standard run of the MER pipeline is performed on sky regions called MER tiles fed with the following input:
The MERTile (not distributed in Q1) to process;
The list of VIS calibrated quad frames intersecting the tile;
The list of NIR calibrated frames intersecting the tile;
The list of EXTExtStackedFrame (not distributed in Q1) covering the tile;
A MERConfigurationSet (not distributed in Q1), specifying the parametrization of the pipeline processing elements;
The MERMachineLearningModels (not distributed in Q1) to be used for source classification;
A MERDqcStaticFlagLimits (not distributed in Q1) containing a list of quality parameter ranges used to flag invalid output data products;
An EXTExtGaiaCutout not distributed in Q1, used to flag objects close to Gaia sources that are likely false positives detections;
A set of ancillary files, stored in the Mission Data Base product.
The MER pipeline workflow is summarised in the figure below.
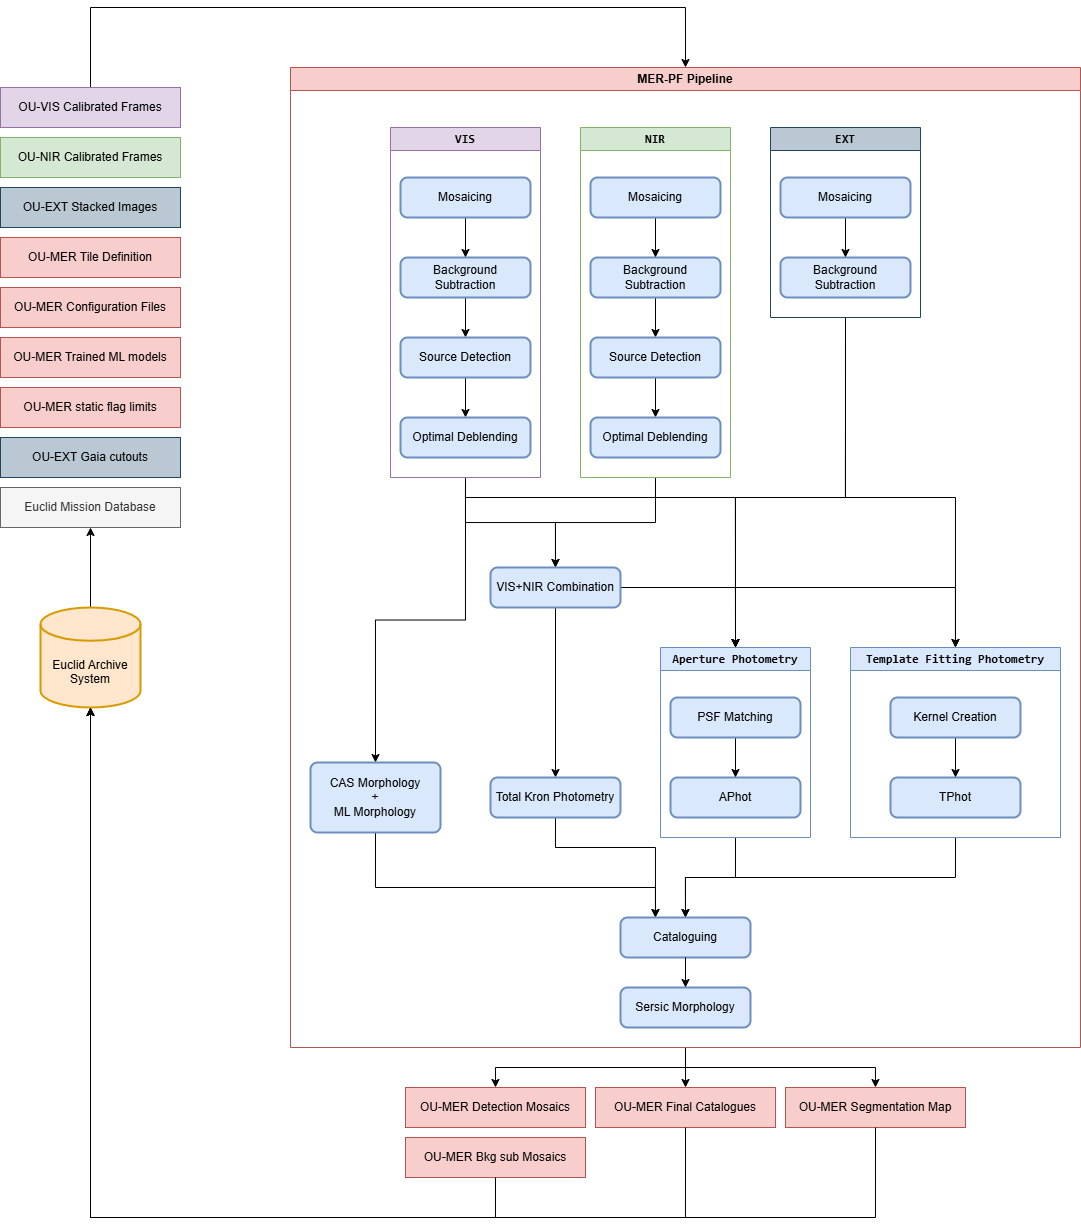
Fig. 31 Schematic view of the MER processing pipeline.
After a first initialization step, aimed at decompressing and sorting the input images, the MER pipeline produces the mosaiced images. On each mosaic, a background subtraction algorithm evaluates the background. The goal of this step is to remove any remaining residual background from the input images.
The list of source candidates is extracted from the VIS mosaic and from a stack of the three NIR bands, independently. This preliminary segmentation of the image is then refined by an optimal deblending algorithm and the VIS and NIR source lists are then merged in one single list, taking care of source duplicates.
At this point, the input Point Spread Functions (PSFs) are propagated for each mosaiced image and evaluated at the detected sources positions, together with the PSF convolution kernels required by the Photometry algorithms.
The list of VIS+NIR detected sources is used as a baseline to force the photometry measurements in the detected loci. For each source, the MER pipeline measures:
The Kron total flux, measured on the detection mosaics;
Aperture photometry on all the input bands;
Template fitting photometry on all the input bands.
For all the sources detected in the VIS band, the MER pipeline provides a measure of the CAS parameters, a point-like probability and a list of other morphological features measured via a Machine Learning approach.
A cataloging unit then carries out the merging of all the information provided by the previous steps. Before releasing the output products to the Euclid Archive System (EAS), a final step runs on all the mosaiced images and the final source catalogue, performing a Sersic fit and adding further photometry and morphology informations.
The MER pipeline returns the following products:
The list of MER background-subtracted mosaics, one for each band, used to measure the source photometry;
The MERDetectionMosaic (not distributed in Q1) used to get the list of VIS and NIR detected sources;
The MER segmentation map containing the spatial pixels associated to each individual source;
The MER final catalog storing all the source information measured by the pipeline.
MER has a second validation pipeline that is generally run after the main pipeline has completed. This pipeline takes all the MER output products together with an EXTExtGaiaCutout (or a MERTrueUniverseStarCatalog and a MERTrueUniverseGalaxyCatalog in the case of running on simulations) and returns a MERAnalysisResult product containing many useful parameters and figures that are used to evaluate the quality of the products. All these products are not distributed in Q1.