Introduction
The SIR Processing Function is in charge of reducing all the NISP spectroscopic data of the Euclid wide and deep surveys.
It is also in change to manage calibration fields to create a set of Calibration Data Products to be used on Euclid survey data processing.
The purpose of this section is to describe data produced by the SIR Pipelines to allow other PFs (mainly SPE and LE3) to design their interfaces with SIR. A description of the SIR PF can be found on the SIR Software Description Document (SDD, EUCL-IPN-DDD-8-001), which is based on the SIR Requirements Specifications Document (RSD, EUCL-IMI-RS-8-001).
List of SIR Data Products
There are two types os SIR Data Products:
the SIR Calibration Data Products as results of the SIR Calibration Pipelines execution on the calibration fields;
the SIR Scientific Data Products as result of the SIR Science Pipelines execution on scientific pointing.
SIR Calibration Data Products
The SIR Calibration Data Products are used as input for the SIR Science pipelines to remove instrument signature and also to located, extracted, and calibrate the spectra. The produces are not useful for other PF, but the are used by SIR Scientific Pipelines.
SIR Calibration Data Products Summary
Dpd Data Product |
Description |
|---|---|
SIRDetectorScaling (Not part of Q1) |
The average QE maps weighted over wavelength |
SIROPTModel (Not part of Q1) |
The astrometry model |
SIRCRVModel (Not part of Q1) |
The description of the spectral curvature |
SIRIDSModel (Not part of Q1) |
The relation between wavelengths and pixels |
SIRSpectralPSFModel (Not part of Q1) |
The description of the 2D spectrogram width |
SIRRelativeFluxScaling (Not part of Q1) |
The description of the large-scale spatial transmission variations |
SIRabsFluxCalibratiion (Not part of Q1) |
The sensitivity functions |
SIR Scientific Data Products
The SIR Scientific Data Products are the outputs of the SIR Science Pipelines runs.
- SIR has 2 main scientific IAL pipelines that run at different levels of granularity.:
the SpectraExtraction Pipeline, which runs on an Observation bases. It starts from a LE1 frames and ends producing 1D calibrated spectra (SIRExtractedSpectraCollection - not distributed in Q1).
the SpectraCombination Pipeline, which runs on a MER tile bases. Starting from the SIRExtractedSpectraCollection, it stacks single dither spectra producing 1D Combined Spectra.
Both the 2 pipelines run on data coming from wide fields (composed by 4 dithers) and deep fields (composed by 60 dithers).
For each dither the SpectraExtraction Pipeline produces:
1 background subtracted frame;
16 : SIRLocationTable (not part of Q1) (1 for each detector): these products contain information about location and geometry of the spectra within the frame;
1 : SIRLE3LocationTable (not part of Q1): short version of the LocationTable designed for the SAS;
16 : SIRExtractedSpectraCollection (not part of Q1) (1 for each LocationTable): these products contain spectra wavelength and fluxes calibrated.
For each MER tile the SpectraCombination Pipeline produces 1 Combined Spectra Collection.
The Processing Elements directly involved in the production of these produces are the following.
Spectra Location Processing Element
The Spectra Location PE uses preprocessed frames and geometrical models to produce both the SIRLocationTable and the LE3 LocationTable SIRLE3LocationTable>
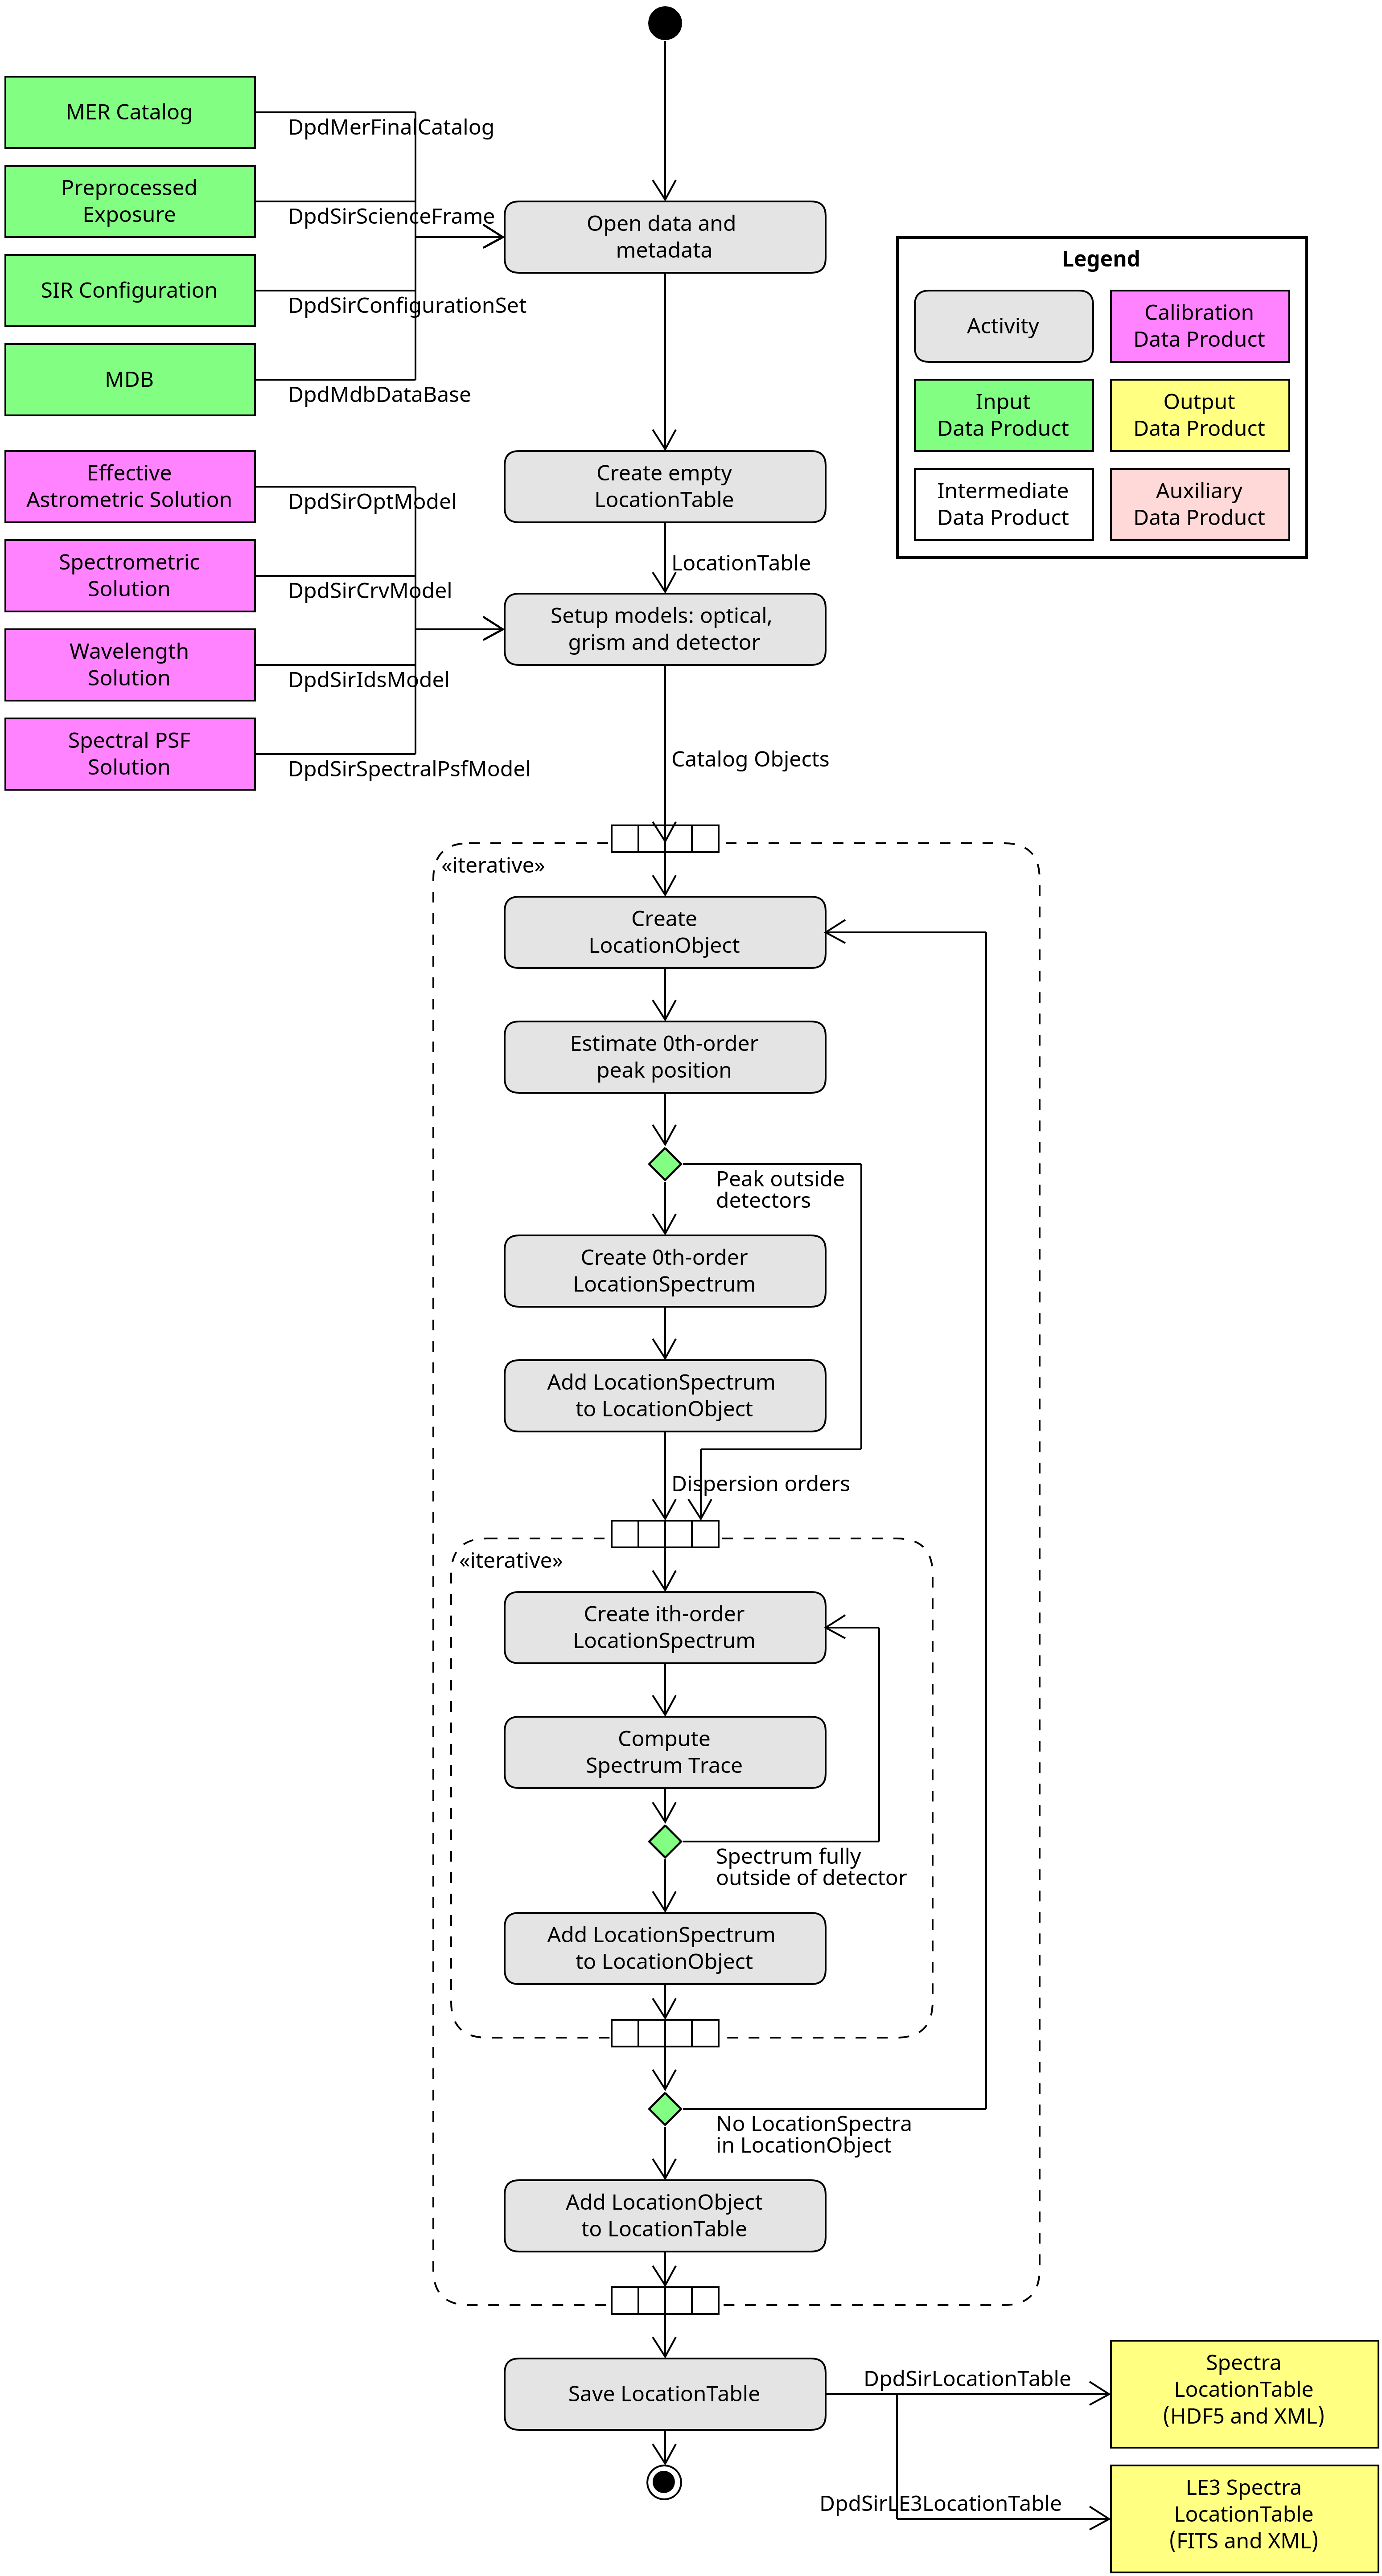
Fig. 24 : The Spectra Location processing element description
Background Subtraction Processing Element
The BackgroundSubtraction PE produces background subtracted frames using preprocessed frames. Input Location Tables are used to mask out spectra signals.
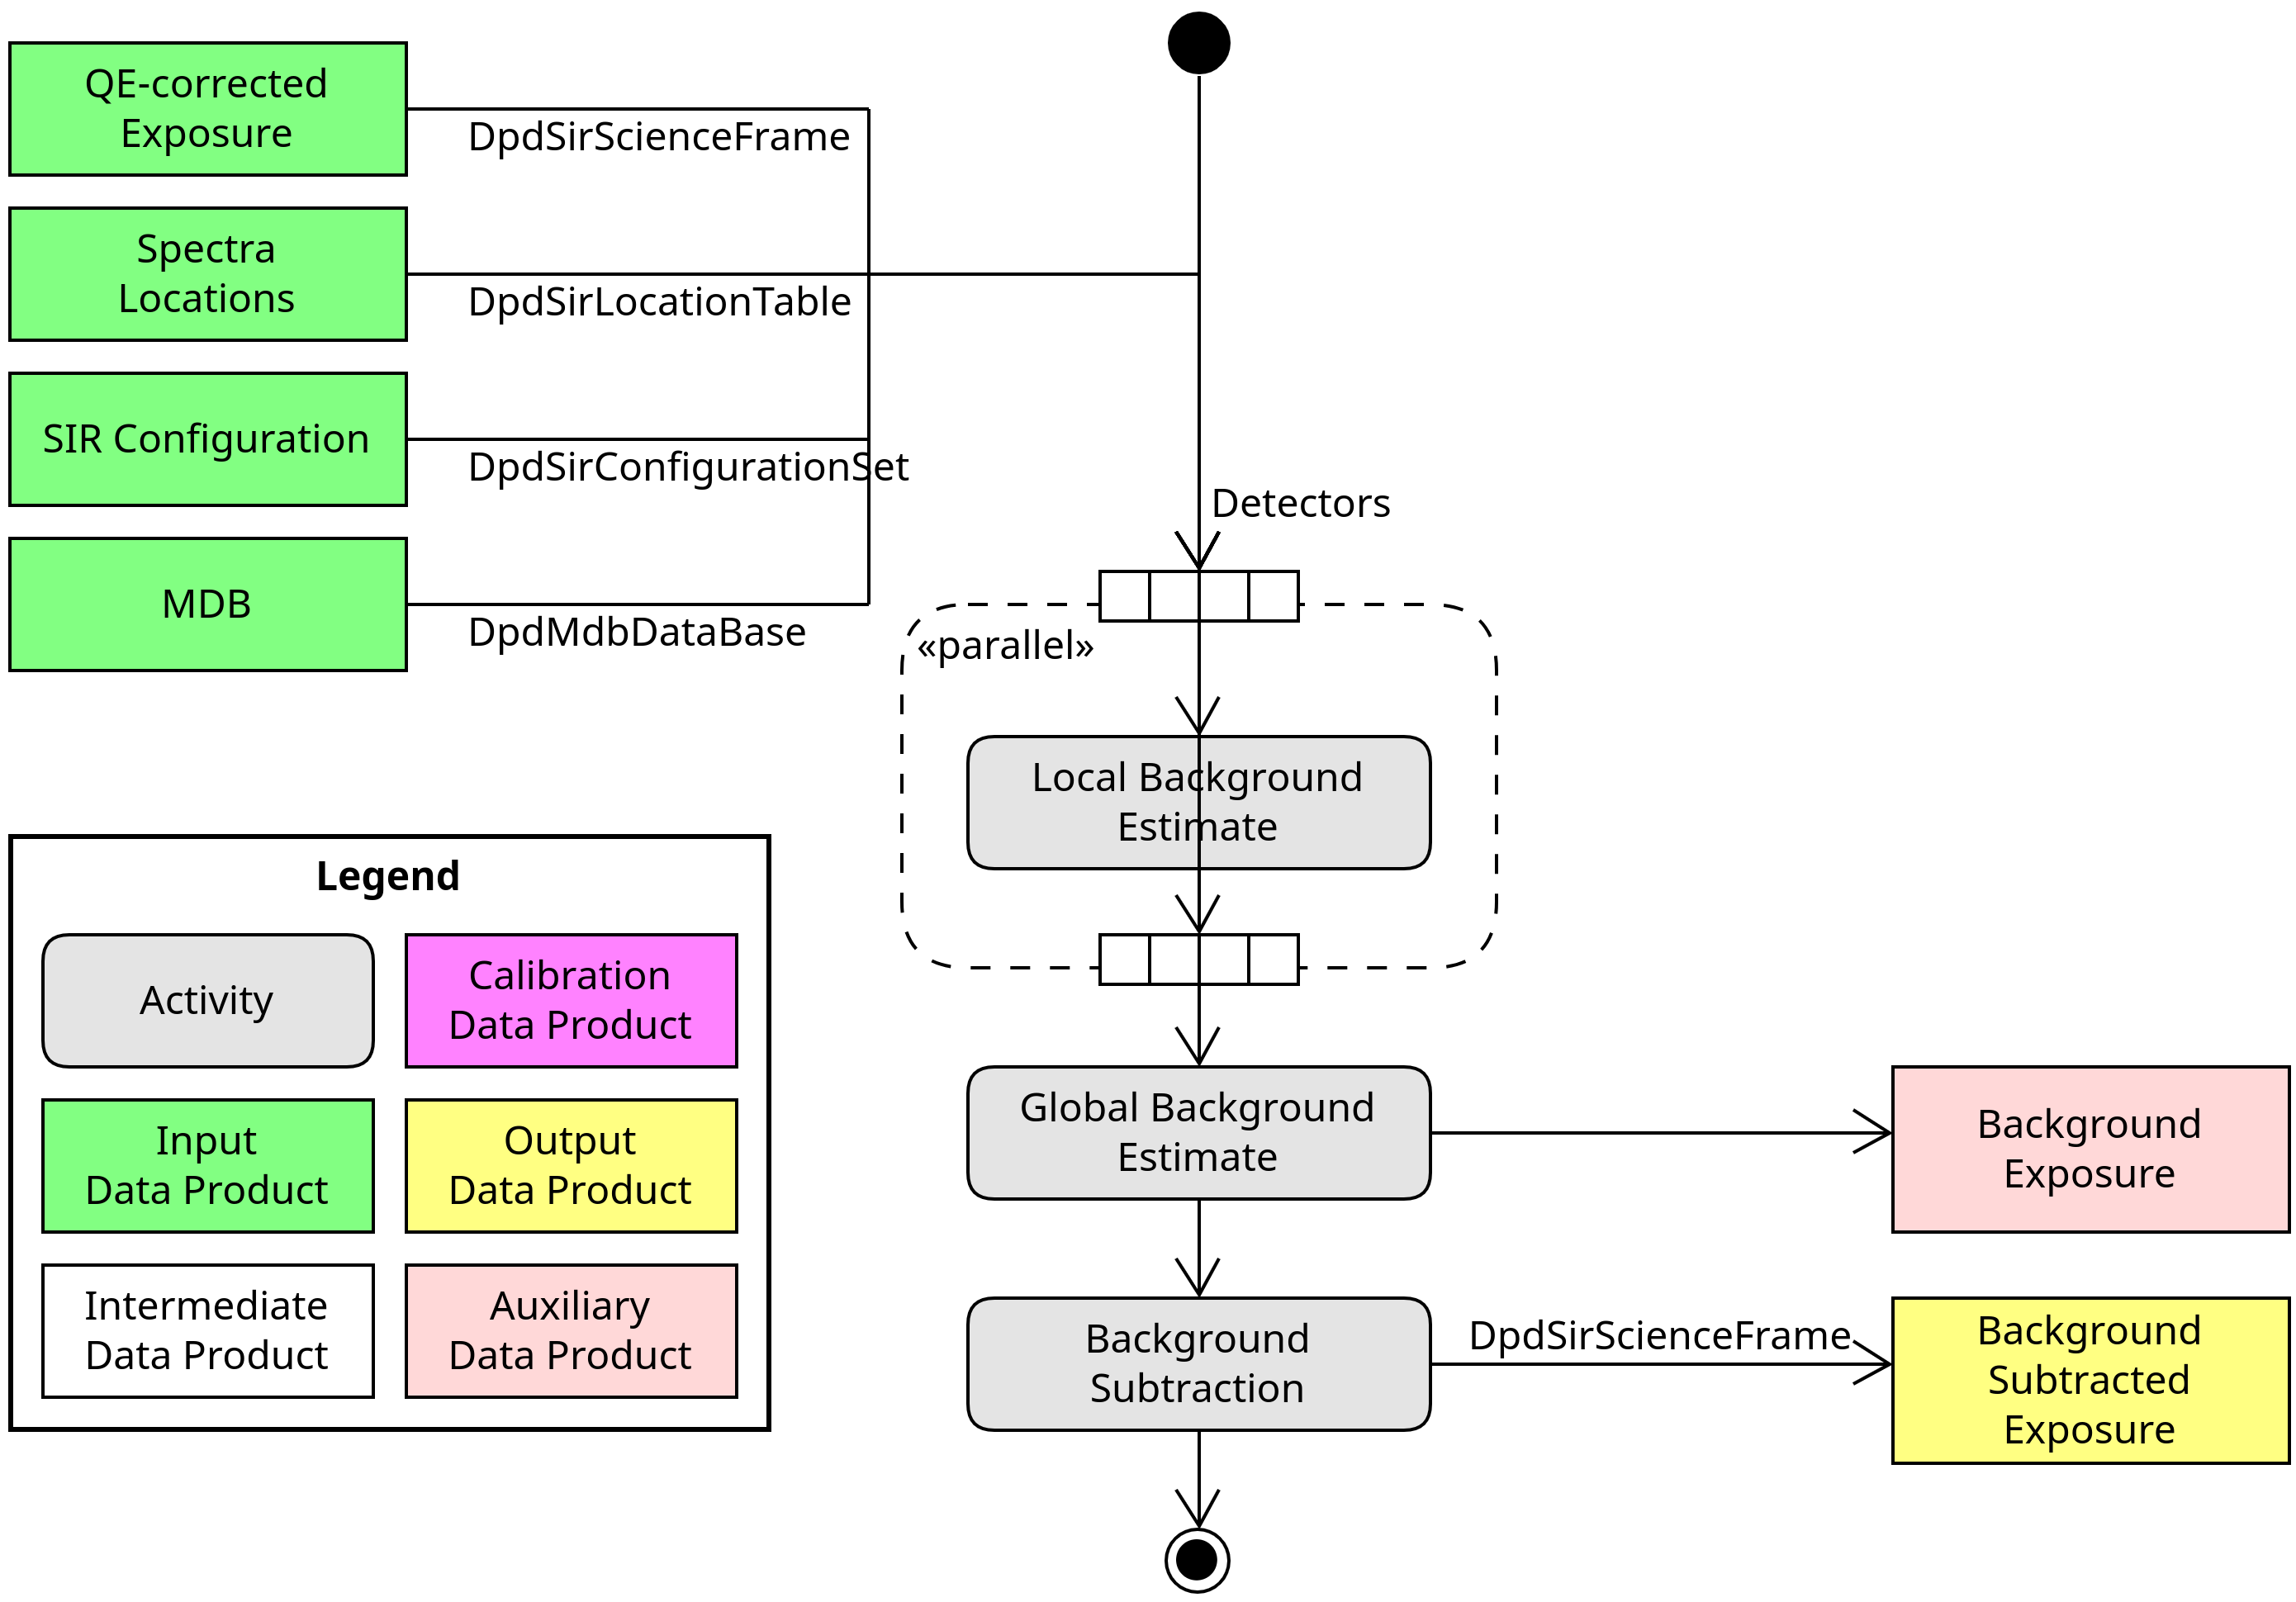
Fig. 25 : The Background Subtraction processing element description
1D Extraction, Relative and Absolute flux calibrations Processing Elements
The 1D Extraction, the Relative and the Absolute flux calibrations PEs running in sequence produce the final SIRExtractedSpectraCollection ready to be combined [1].
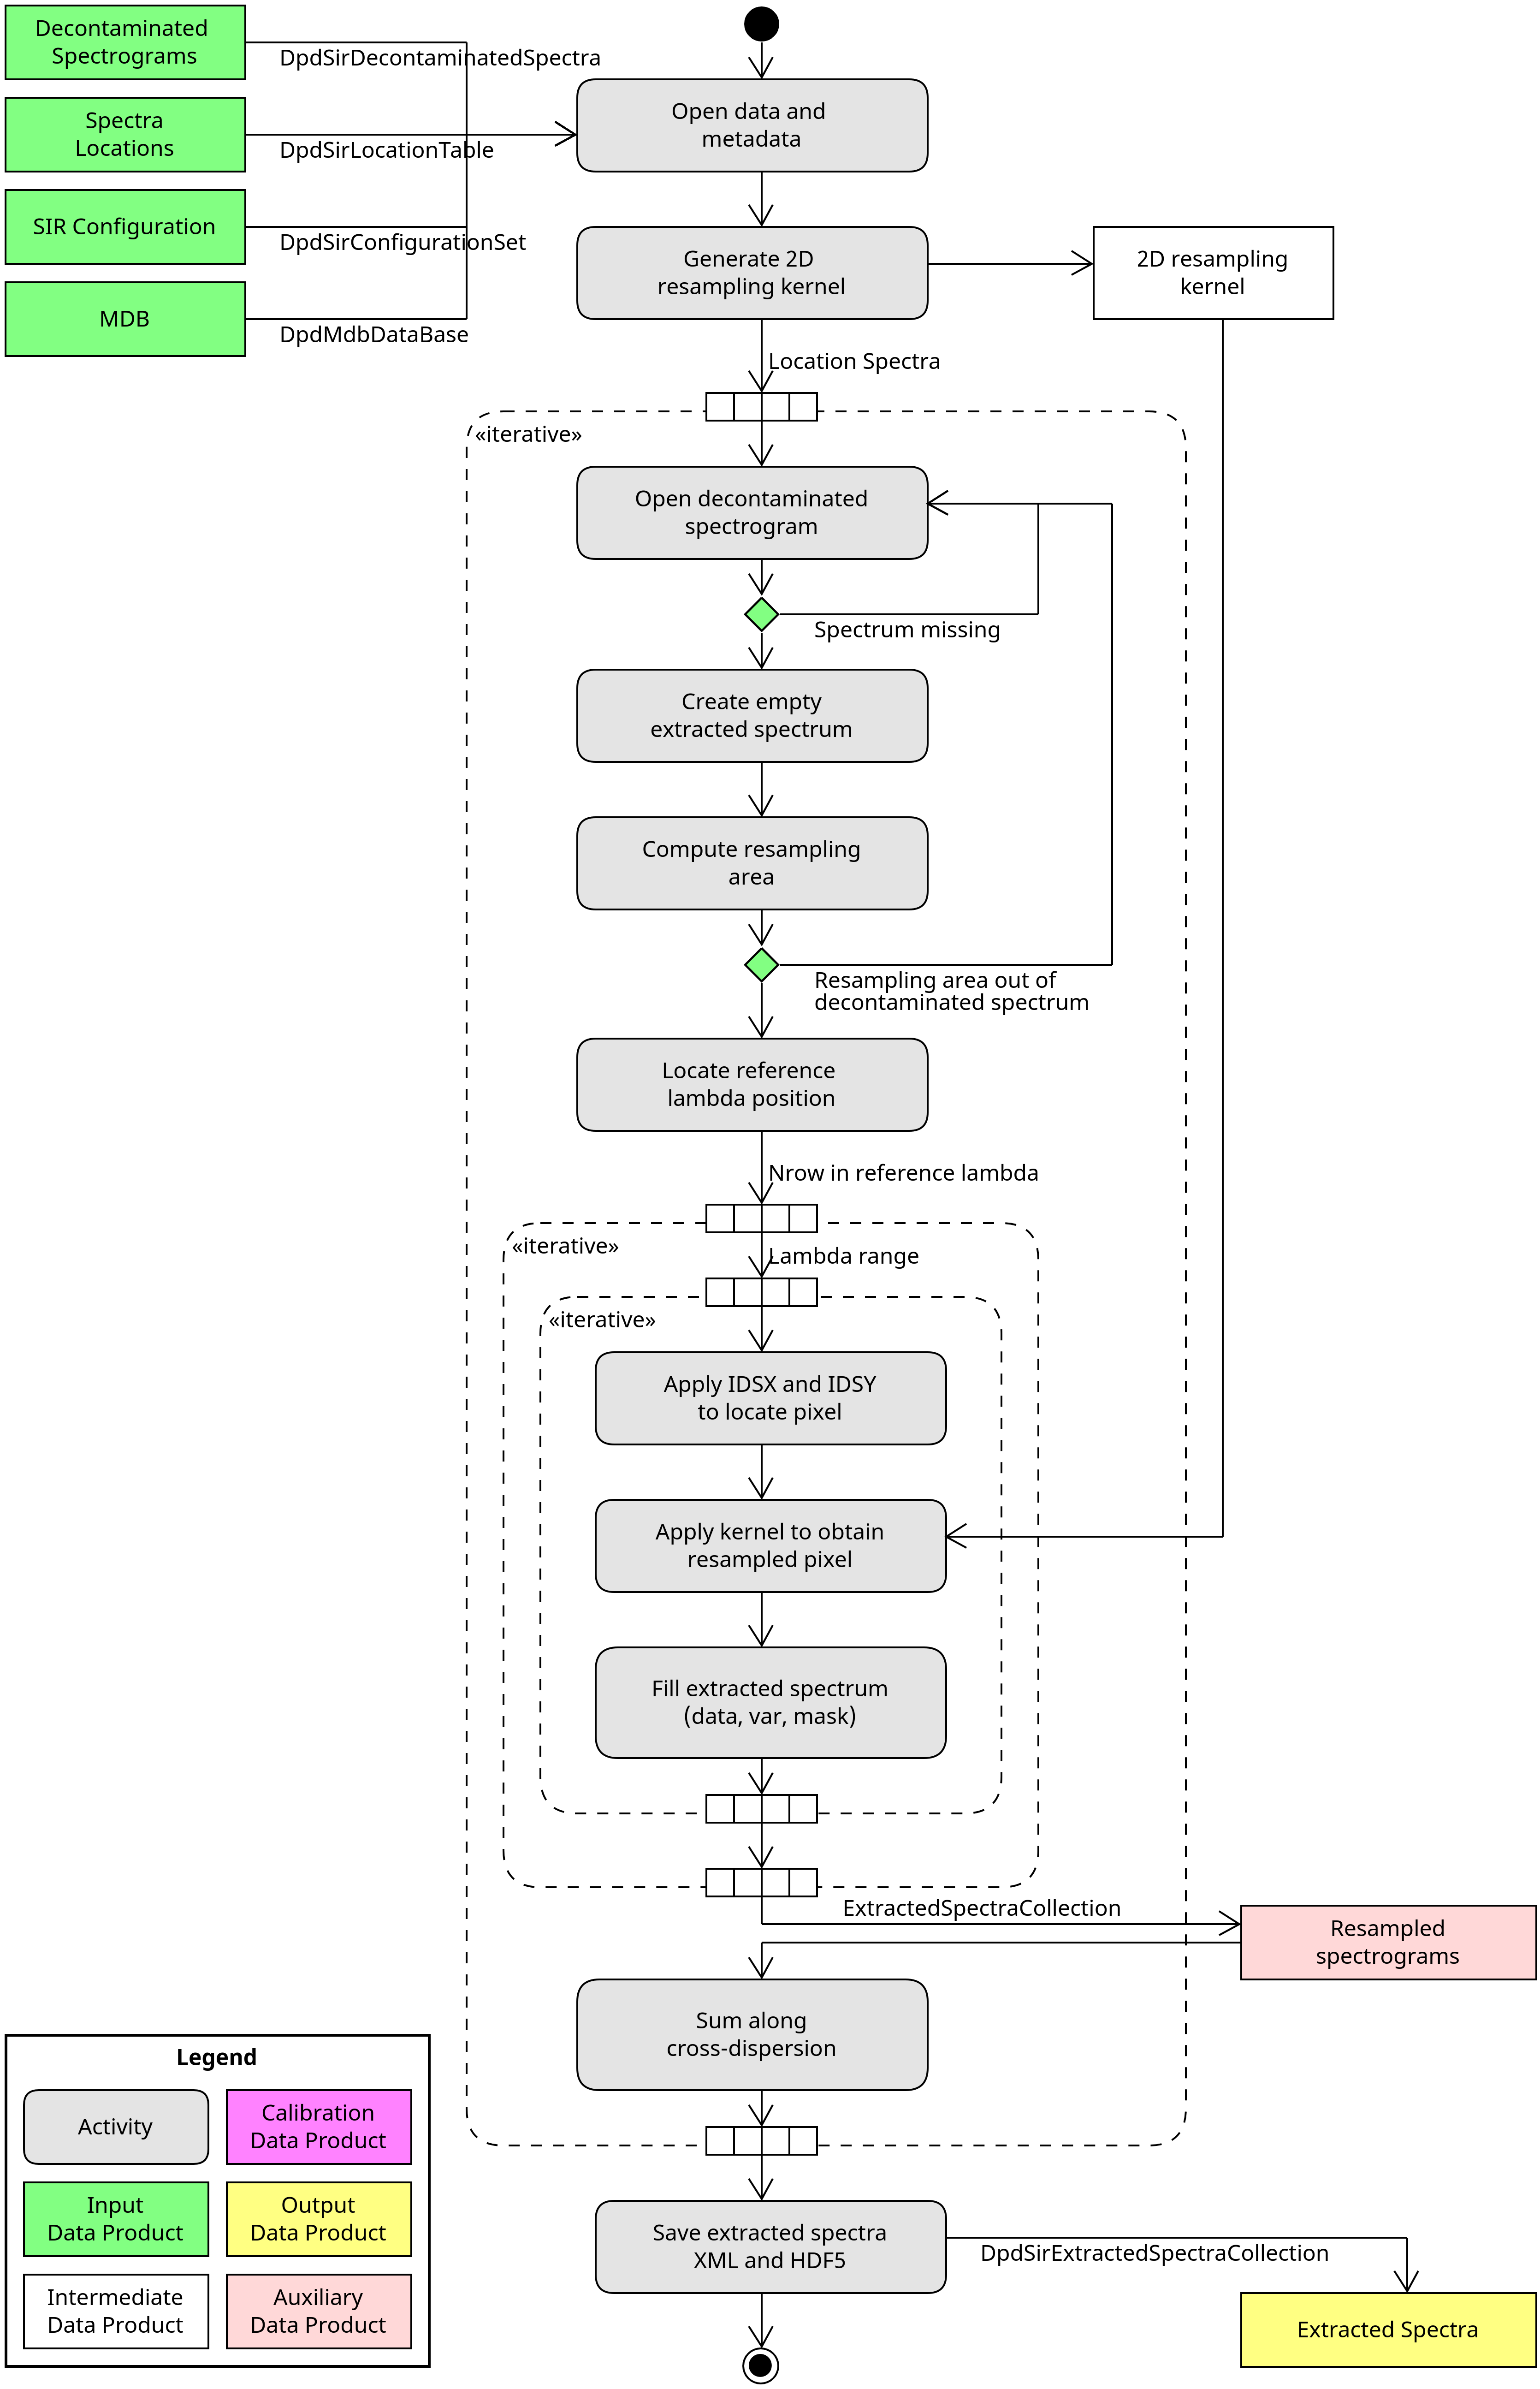
Fig. 26 : The 1D Extraction processing element description
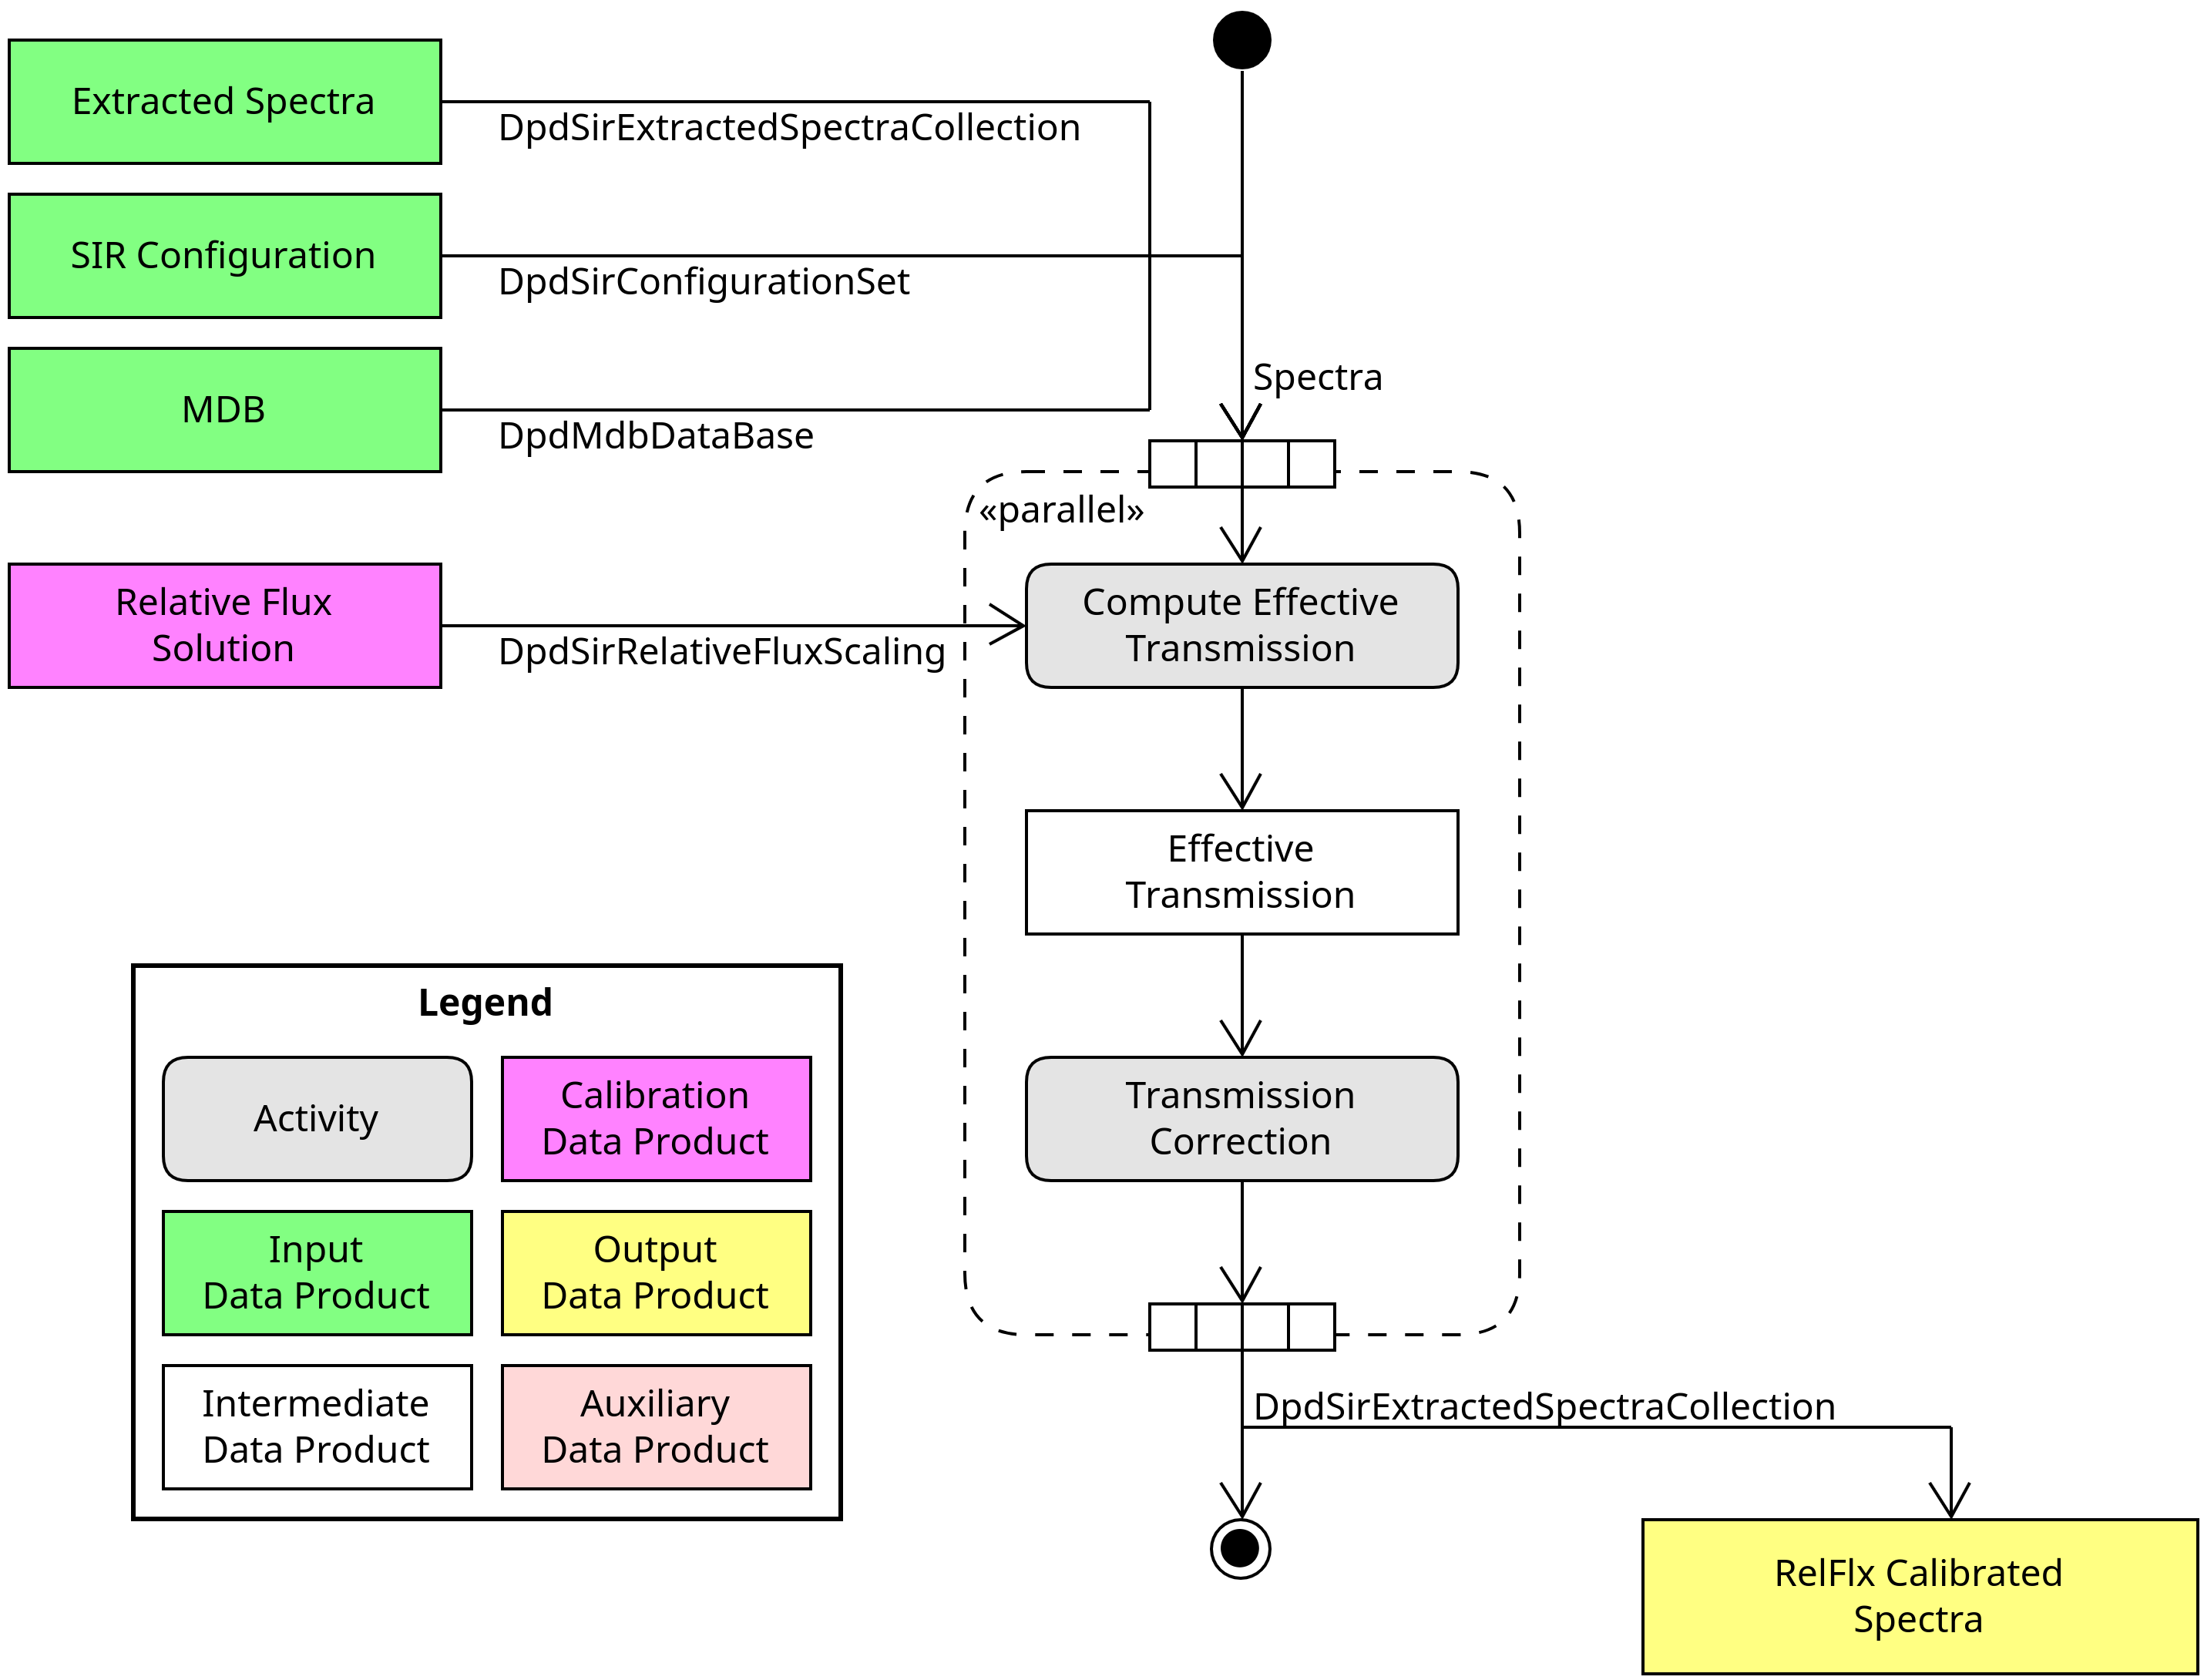
Fig. 27 : The Relative Flux Calibration processing element description
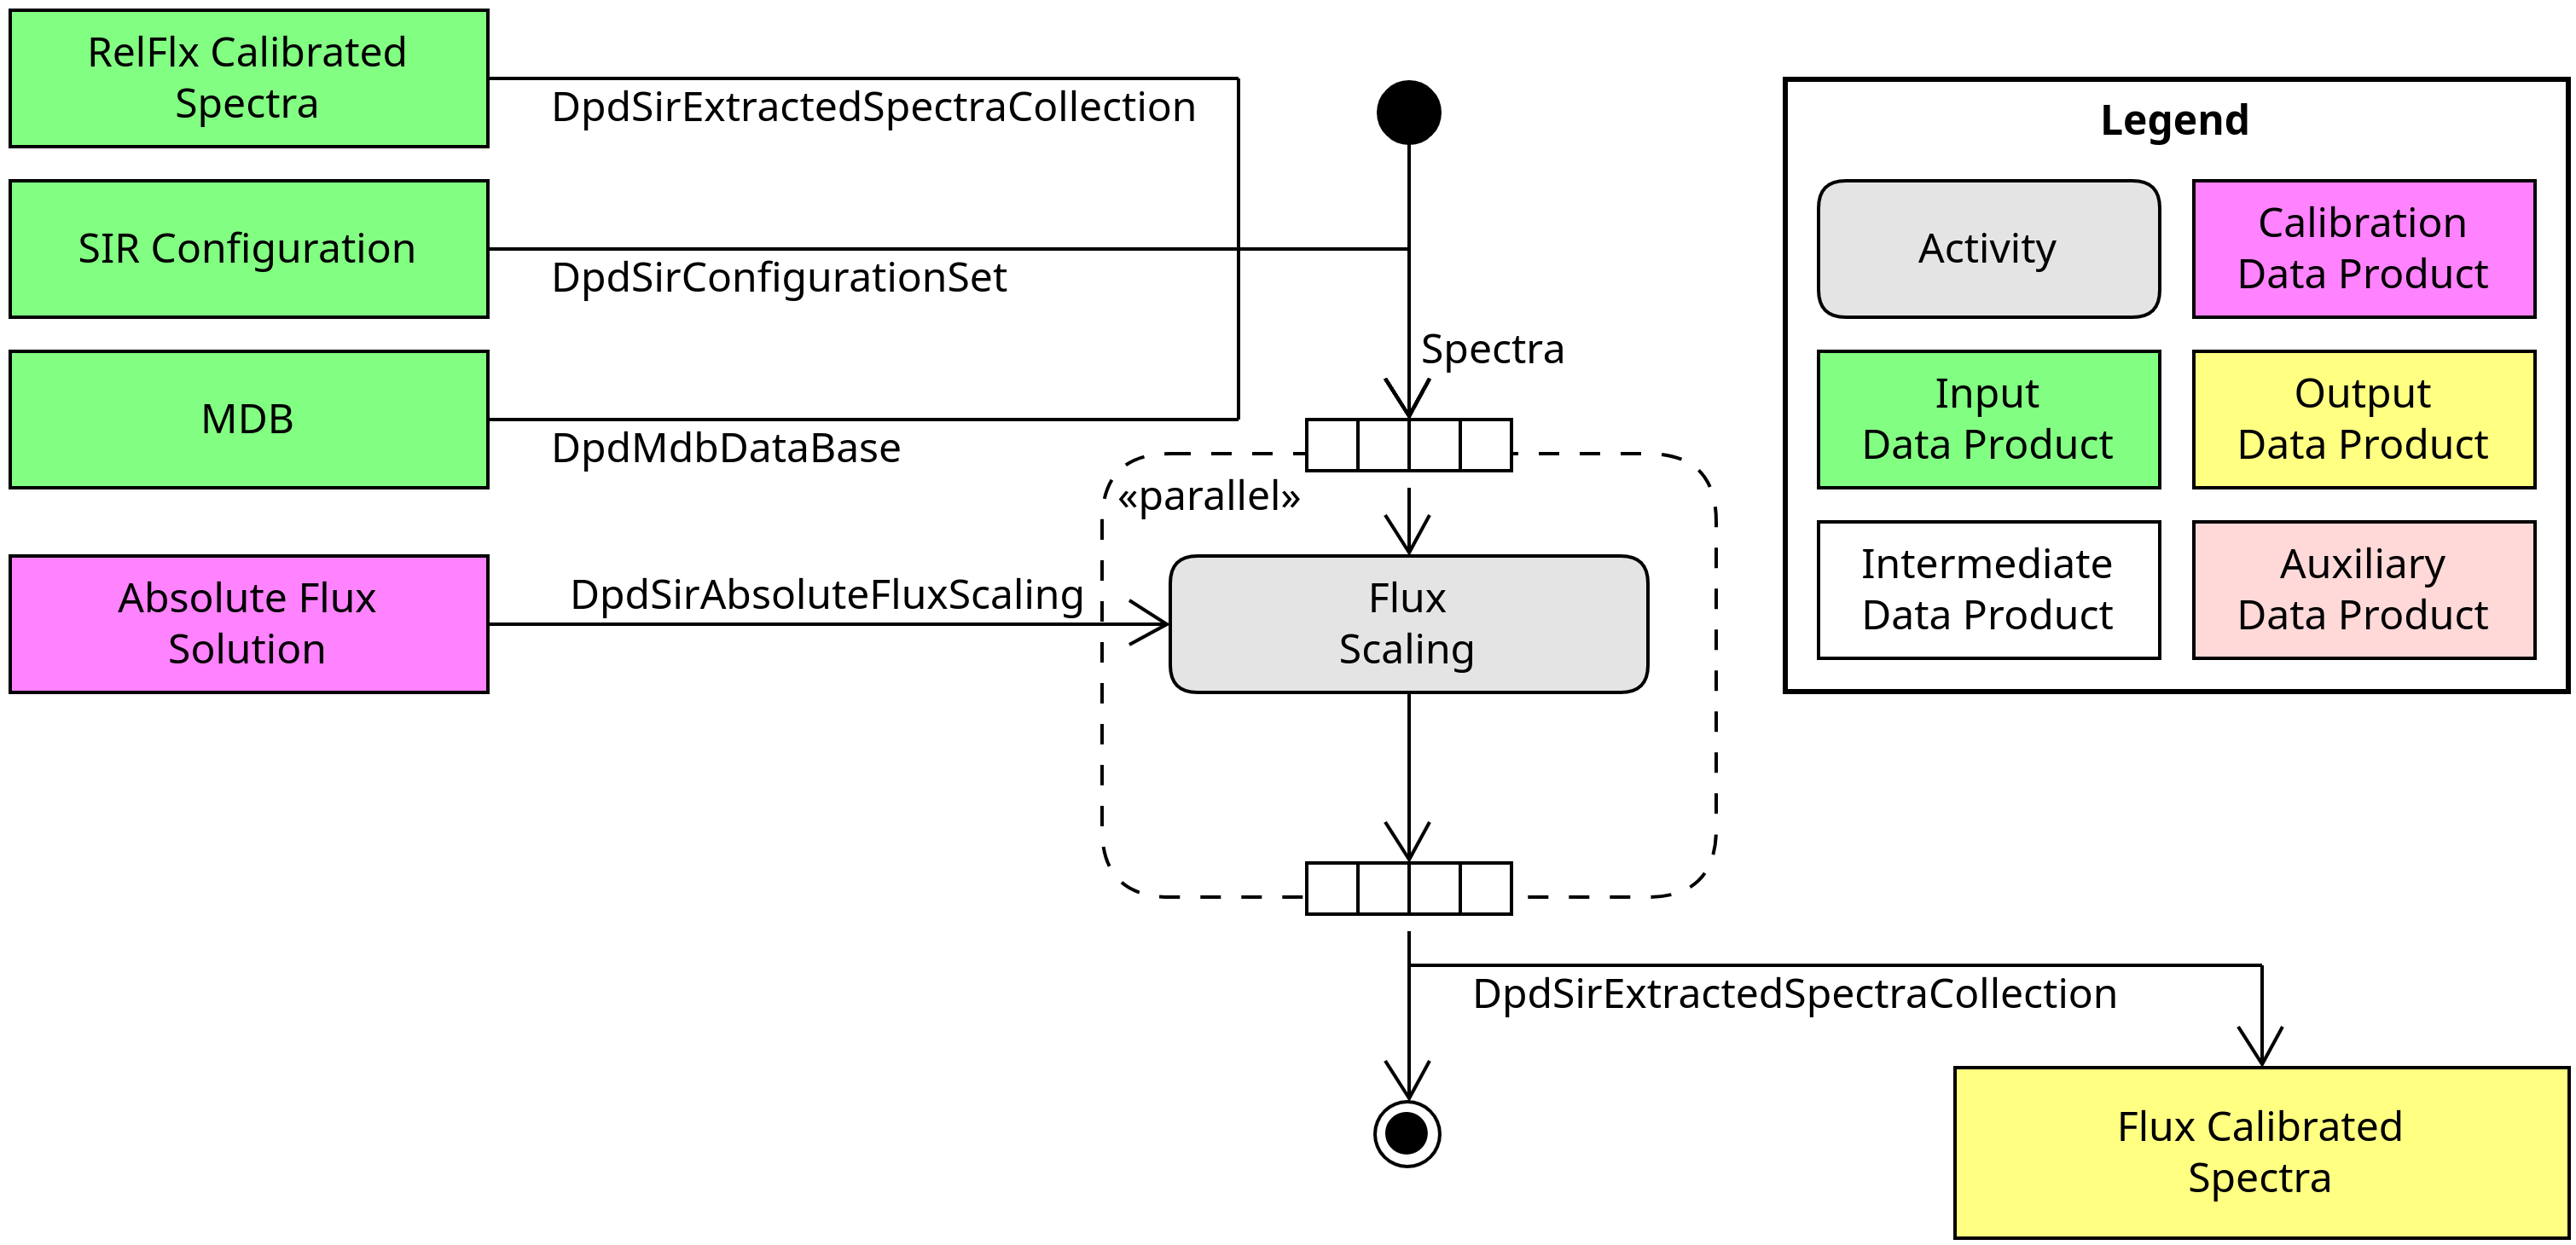
Fig. 28 : The Absolute Flux Calibration processing element description
Spectra Combination Processing Element
Once the Extracted Spectra from all dithers covering a MER tile have been produced, the SpectraCombination Pipeline runs producing 1 Combined Spectra Collection.
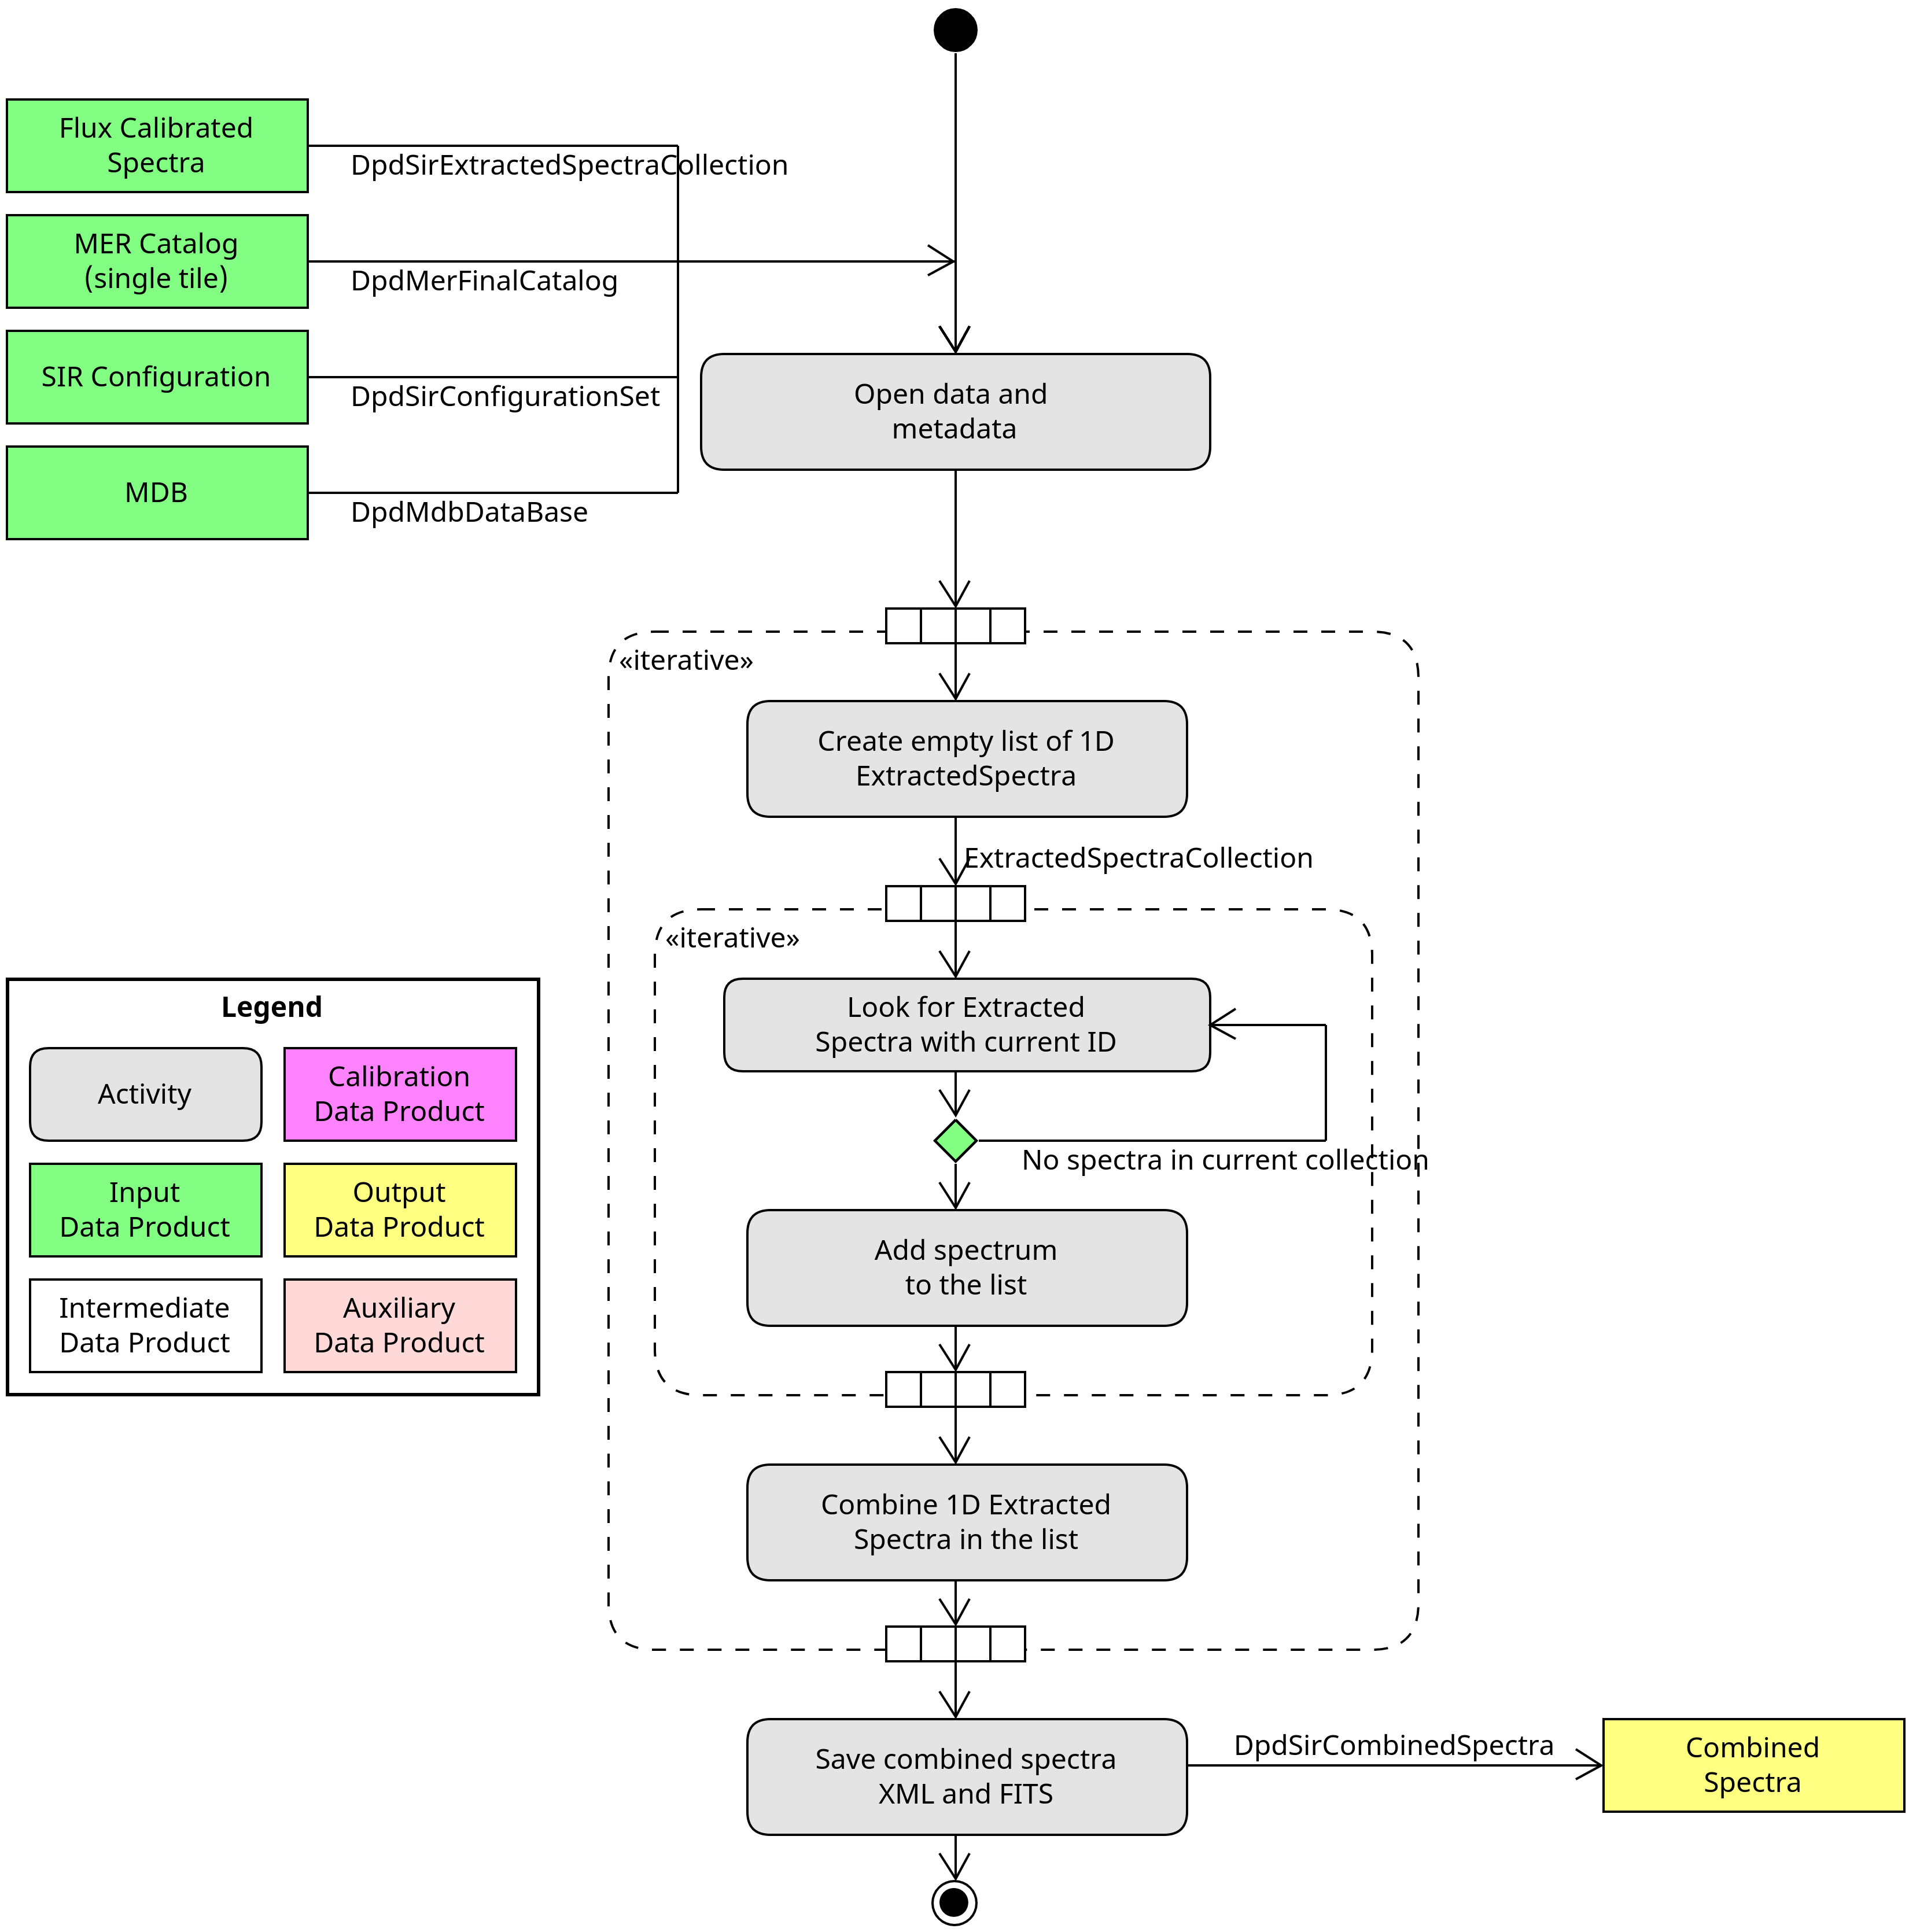
Fig. 29 : The Spectra Combination processing element description
SIR Scientific Data Products summary
Dpd Data Product |
Description |
|---|---|
SIRLocationTable (Not part of Q1) |
The Location Table used by the SIR-PEs |
SIRLE3LocationTable (Not part of Q1) |
The SAS Location Table |
The background subtracted frames |
|
SIRExtractedSpectraCollection (Not part of Q1) |
The (single dither) extracted spectra |
The (all dithers) combined spectra |
SIR Configuration Set
This special Data Product (SIRConfigurationSet, not part of Q1) is used to collect all the configuration parameters used to run the pipelines. It is manually produced and uploaded to the archive.